How the samples are arranged
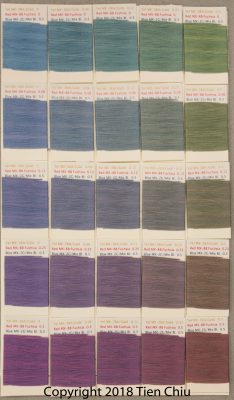
You can always see the concentrations of each dye used to make the sample by clicking on the photo to get the larger version, then zooming in on the label for that sample.
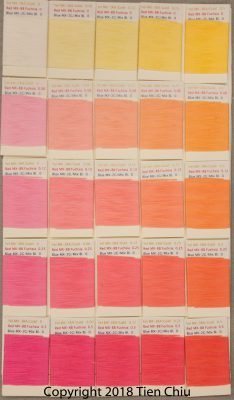
Here’s a page from one of the sample sets that shows three levels of a single dye “cube”.
The first level has five concentrations of yellow, increasing from left to right, and five concentrations of magenta, increasing from top to bottom. It contains no blue.
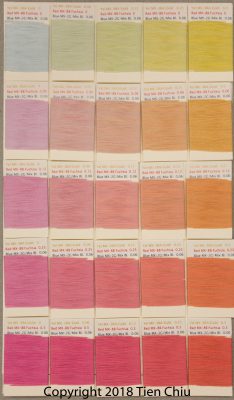
The second level contains the same five concentrations of yellow, increasing from left to right, and five concentrations of magenta, increasing from top to bottom. However, each of the samples has also been dyed with 0.06% blue.
In essence, the second level is what you get when you take the first level, and add 0.06% blue to each sample.
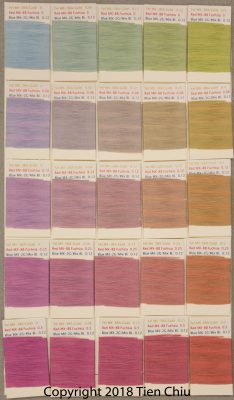
The third level also has the same five concentrations of yellow and magenta, but 0.12% blue has been added.
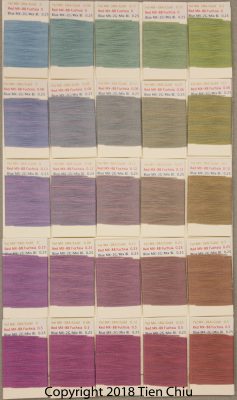
Level 4 adds 0.25% blue:
And Level 5 adds 0.5% blue.
So each image contains yellow and red in every possible combination of the five concentrations, plus a single concentration of blue.
There are a total of 125 skeins in each “light” cube. They represent all possible combinations of the three dyes, in each of the 5 concentrations (0, 0.06%, 0.12%, 0.25%, and 0.5%).
There are 125 skeins in each “dark” cube, representing all possible combinations of the three dyes, in each of the 5 concentrations (0, 0.5%, 1%, 2%, 4%).
For more on how and why I chose these colors and combinations, see my Dye Sample Strategy page.
